What is statistics?
It’s the science of collecting, summarizing, presenting, and interpreting data, and using them to test hypothesis
Why are statistics is a central role in Medical Investigations?
Firstly, it provides a way of organizing information on wider and more formal basis than relying exchange of anecdotes and personal experience.
Secondly, more and more things are now measured quantitatively in Medicine.
Thirdly, there is a great deal of intrinsic variation in most biological processes, for example blood pressure differ from person to person, but in the same person it also varies from day to day and hour to hour.
It’s the interpretation of data in the presence of such variability that lies at the heart of statistics.
[!example]+ Investigating morbidity associated with a particular stressful occupation, statistical methods would be needed to assess whether an observed average blood pressure above that of the general population could simply be due to chance variations or whether it represents a real indication of an occupational health risk.
Variability can also arise through the random operation of chance within a population. Individual do not all need to react in the same way to a given stimulus.
[!example]+ Although smoking and drinking are in general bad for health, one not infrequently hears of a heavy smoker and drinker living to a healthy old age, whereas non-smoking teetotaler may die young.
[!example]+ Consider the evaluation of a new vaccine. Individuals vary both in their responsiveness and in their susceptibility and exposure to a disease. Not only will some people who are unvaccinated escape infection, but also a number of those who are vaccinated may contract the disease.
What can be concluded if the percentage of people free from the disease is greater among the vaccinated group than among the unvaccinated?
Is the vaccine really effective?
Could the results just be due to chance?
Or, was there some bias in the way people were selected for vaccination, for example were they of different ages or scocial class, such that their risk of contracting the disease was in any case lower?
The methods of statistical analysis are used to discriminate between the first two of these possibilities, while the choice of an appropriate design should eliminate the third.
The last example illustrates that the usefulness of statistics is not confined to the analysis of the results. It also has a role to play in the design and conduct of a study.
Population and Samples
Associated with the basic issue of variability is the important point that except when full census is taken, the data are for a sample from a much larger group called population.
This phenomenon, called sample variation, lies at the heart of statistics. It described in detail in Chapter 3).
The word “population” is used in statistics in a wider sense than usual. It is not limited to a population of people but can refer to any collection of objects
[!example]+ The data may relate to a sample of 20 hospitals from the population of all hospitals in the country. In such case it is easy to imagine that the entire population can be listed and the sample selected directly from it.
In many instances, however the population and its boundaries are less precisely specified, and care must be taken to ensure that the sample truly represent the population about which information is required.
This population is sometimes referred to as the target population.
[!example]+ Consider a vaccine trial carried out using student volunteers.
If it’s reasonable to assume that in their response to the vaccine and exposure to disease students are typical of the community at large, the results will have a general applicability.
If, on the other hand, students differ in any respect which may materially affect their response to the vaccine or exposure to disease, the conclusions from the trials are restricted to the population of students and do not have general applicability.
In the above example, the target population includes not only all persons living at present but also those that may be alive at some time in the future. It’s obvious that the complete enumeration of such population is not possible.
Defining the data
The raw data of an investigation consist of observations made on individuals. In many situations the individuals are people, but they need not be. For instance, they might be red blood cells, urine samples, rates or hospitals.
The number of individuals is called the sample size. Any aspect of any aspect of an individual that is measured, like blood pressure, ore recorded, like age or sex, is called a variable. There may be only one variable in a study or there may be many.
It’s helpful to divide variables into different types as different statistical methods are applicable to each.
Qualitative (categorial) variables
It’s a non numerical data, for instance place of birth, ethnic group, or type of drug. A particularly common sort is a binary variable, where the response is one of the two alternatives. For example, sex is male or female, or a patient survives or dies.
Quantitative (numerical) variables
It’s a numerical data, either discrete or continuous. The value of a discrete variable are usually whole numbers, such as the number of cases of covid-19 in a week.
A continuous variable, as the name implies, is a measurement on a continuous scale. Examples are height, weight, blood pressure, and age.
Data analysis and presentation of results
The methods of summarizing and analyzing data in order to interpret the results of a study form the basis of medical statistics. Three general points deserve emphasis here.
The first is that the application of complex methods for their own sake should be avoided, It’s important to start by using basic summary and graphical techniques to explore the data. The analysis should then progress from the simple to the complex. The method chosen should be the simplest consistent with the requirements of the data.
The second and related point is that statistical reasoning should be applied hand in hand with common sense. It’s important not to lose sight of the number themselves, the factors influencing them, and what they stand for while manipulating them in the midst of an analysis.
[!tip]- Bradford Hill (1977), Colton (1974), and Oldham (1968) all have useful chapters illustrating the common fallacies and difficulties that arise in the interpretation of data.
The third point is that graphical techniques are strongly recommended, both during the exploratory phase of an analysis and for the presentation of results, since relationships, trends, and contrasts are often more readily appreciated from a diagram than from a table.
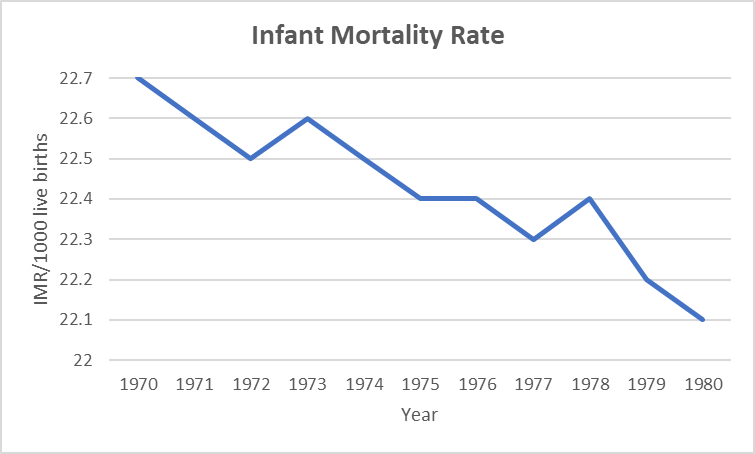
Diagrams (and tables) should always be clearly labelled and self-explanatory; it should not be necessary to refer to the text to understand them. At the same time they should not be cluttered with too much detail, and they must not be misleading. Breaks and discontinuities in the scale(s) should be clearly marked, and avoided whenever possible.
[!example]+
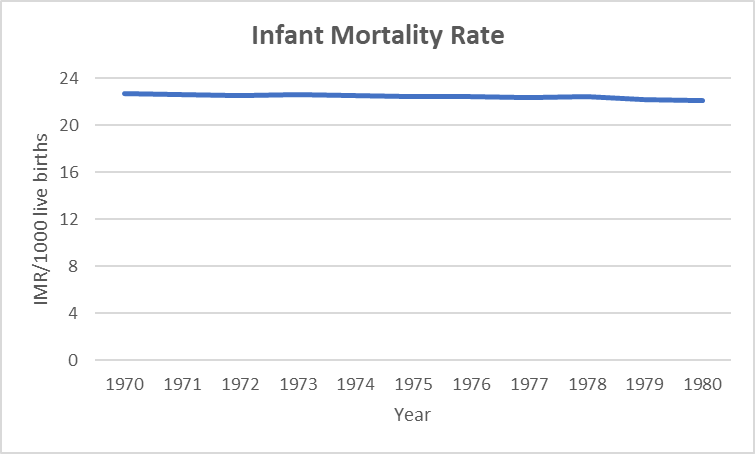
The figure above shows a common form of misrepresentation due to an inappropriate use of scale. The decline in infant mortality rate (IMR) has been made to look dramatic by expanding the vertical scale, while in reality the decrease over the 10 years displayed is only slight ( from 22.7 to 22.1 deaths/1000 livebirths/year )
A more realistic representation is shown in the figure below with the vertical scale starting at zero.